
Pulmonary embolism(PE) and Acute Coronary Syndrome(ACS) causing ischaemia can sometimes be difficult to clinically differentiate. The patient with sinus tachycardia and hypoxia and a history of malignancy and a swollen lower leg, is a straightforward higher risk. However the patient with chest pain and shortness of breath, with a few crackles in the lung bases and saturations of 96% and T wave inversions on their ECG is not that easy.
Look at the two ECG traces below. One is of a patient with a PE and the other of a patient with an LAD occlusion.
Which is which? Is A ischaemia and B PE, or the other way around? (The answer is provided below)
 Have you noticed that when we use scores such as Wells or Geneva or even the PERC rule, to risk stratify patients, they don’t include any ECG criteria for making the diagnosis, although the PERC Rule does use tachycardia.
There are three ECG areas in patients with a potential diagnosis of PE, that I’m particularly interested in:
- What are the ECG findings that are associated with PE?
- Can I differentiate between a PE and ischaemia on an ECG?
- Can features in the ECG predict those patients most likely to rapidly deteriorate?
1 What are the ECG findings that are associated with PE?
There are 10 ECG changes associated with PE:
- S1Q3T3
- T wave inversion in V1-V4
- ST elevation in aVR
- Bundle Branch Block: Complete or Incomplete
- Sinus Tachycardia
- Atrial Fibrillation
- P pulmonale
- Dominant R wave in V1
- Right Axis
- Transition point shift
These are covered in The ECG’s of Pulmonary Embolism
2 Can I differentiate between PE and ischaemia on an ECG?
This is probably the most important question I ask. How did you go with the above ECG quiz?
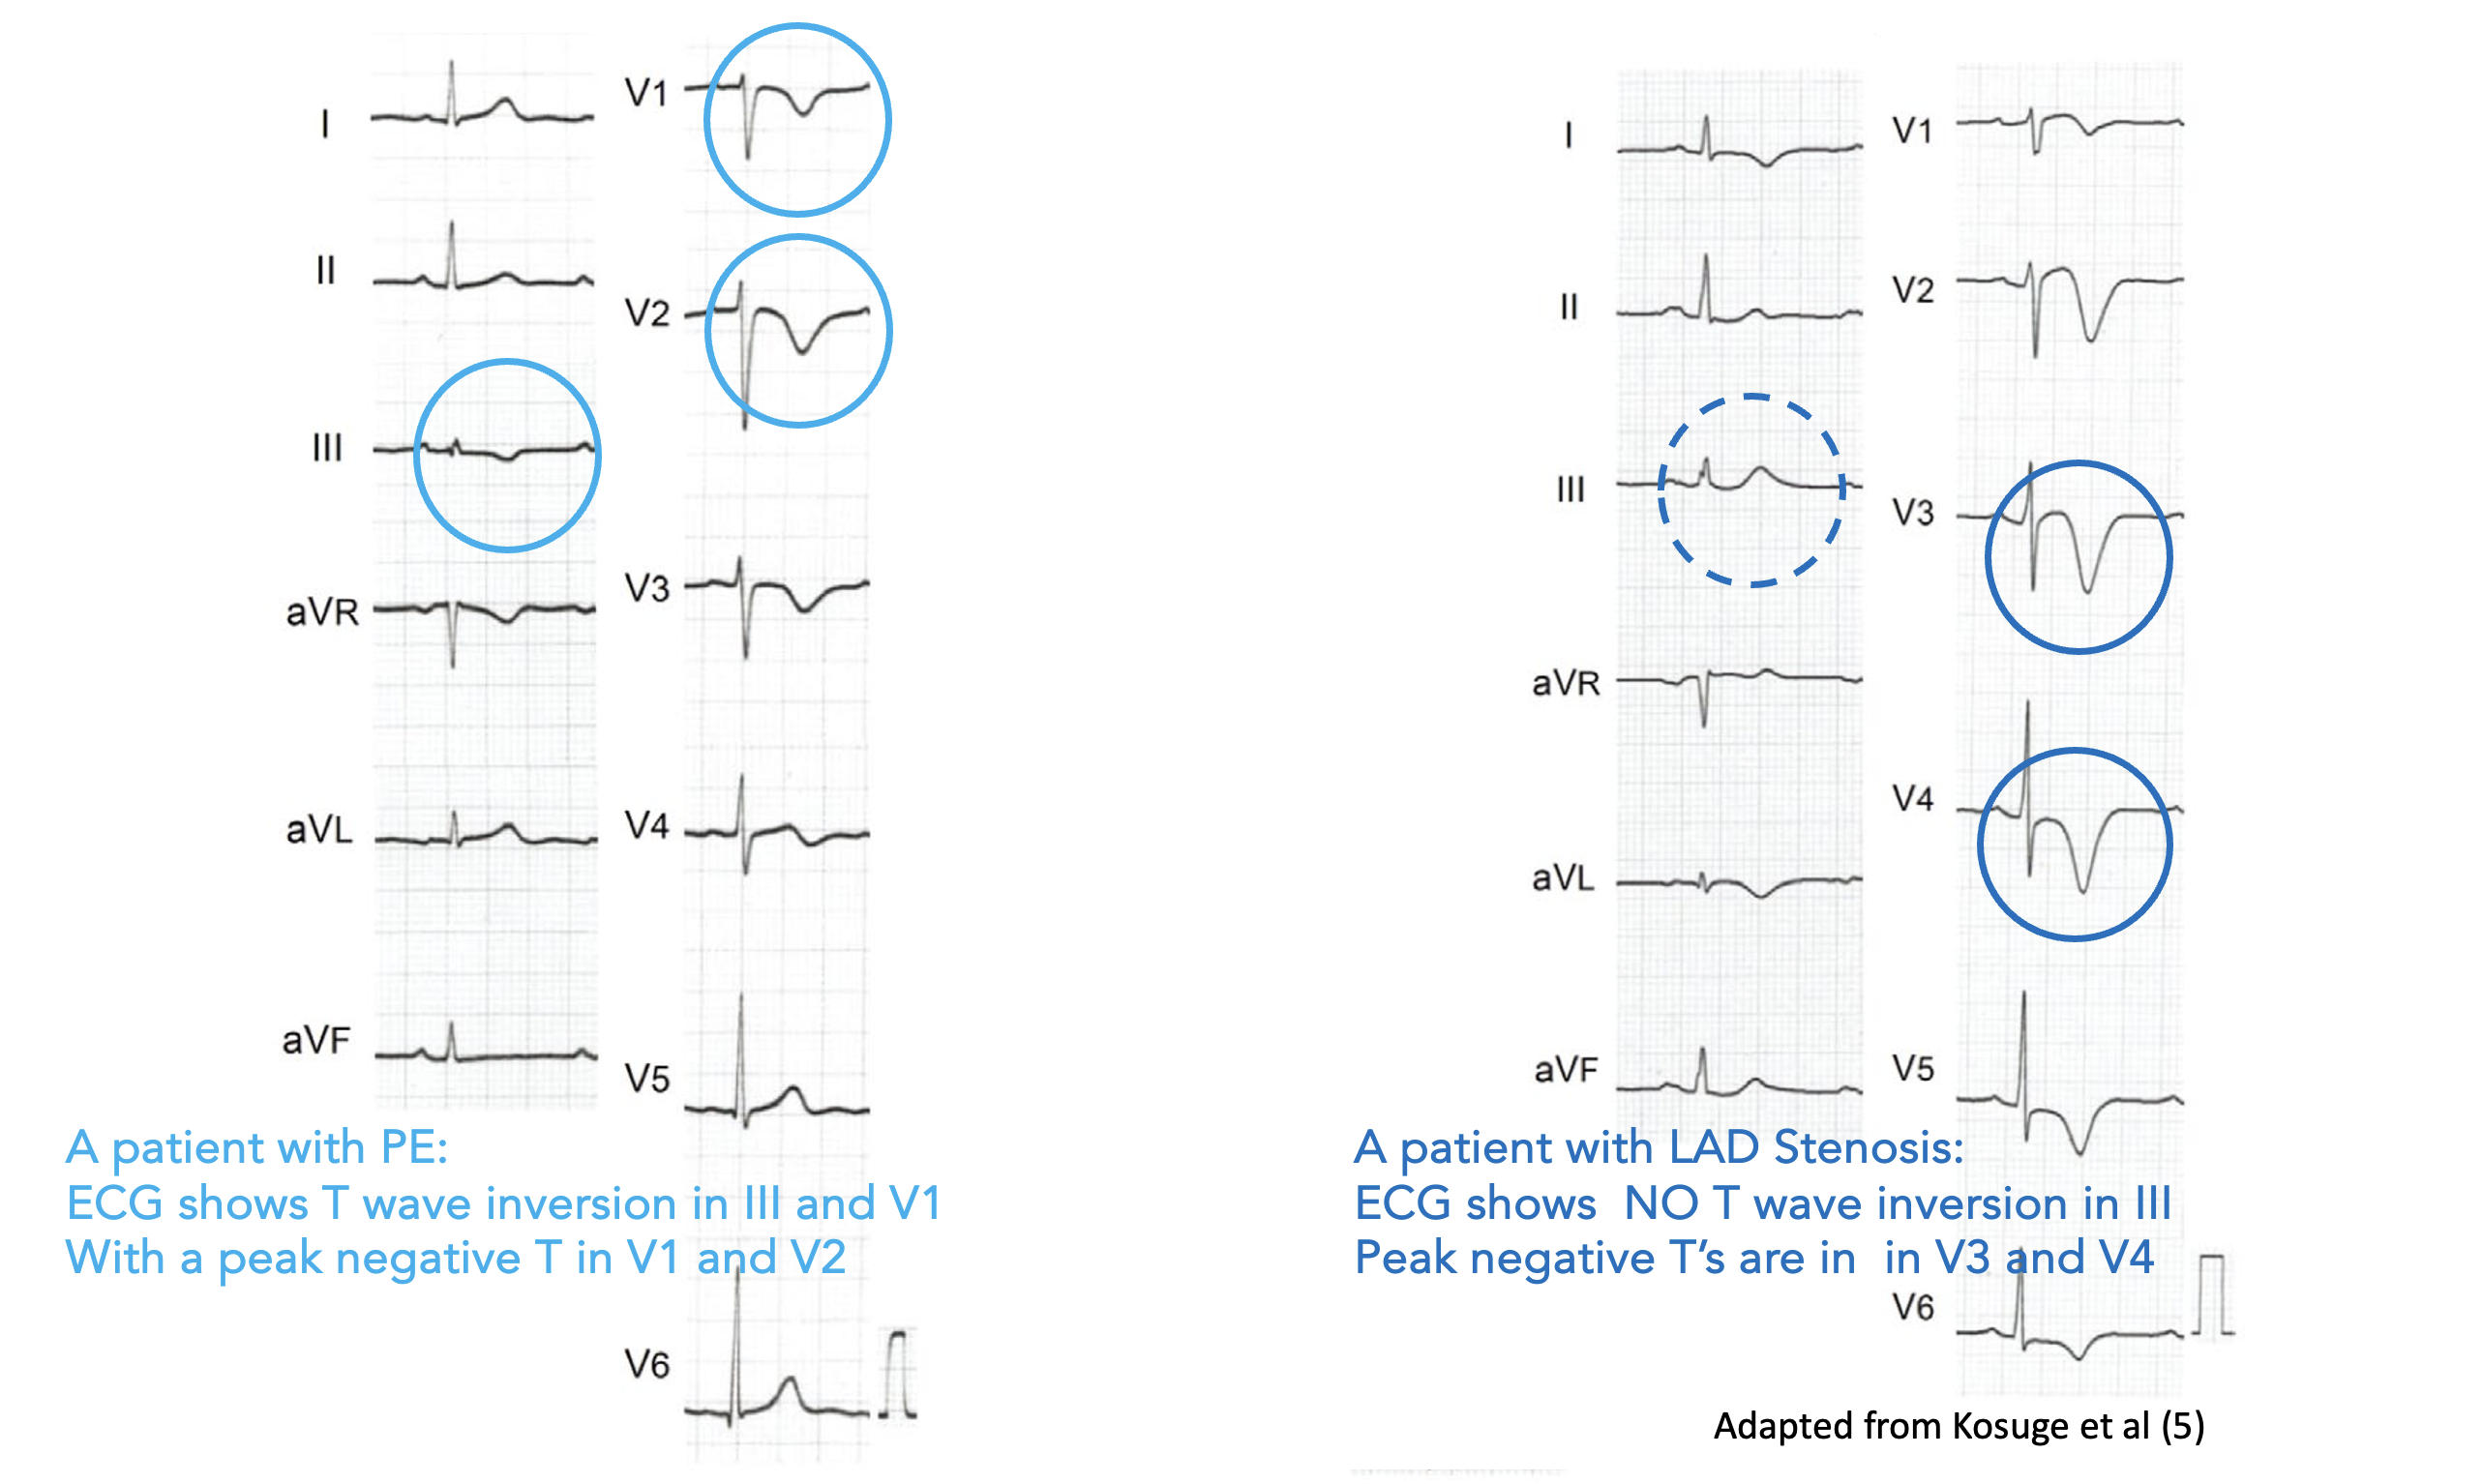
Kosuge et al in their 2007 paper(1) found that:
“Negative T waves in leads III and V1 were observed in only 1% of patients with ACS compared with 88% of patients with PE (p <0.001). The sensitivity, specificity, positive predictive value, and negative predictive value of this finding for the diagnosis of PE were 88%, 99%, 97%, and 95%, respectively. In conclusion, the presence of negative T waves in both leads III and V1 allows PE to be differentiated simply but accurately from ACS in patients with negative T waves in the precordial leads.”
In a further study (2) it was found that negative T waves in the precordial leads, that were maximally negatively(ie., inverted) peaked in V1-2 were more associated with a PE and that maximally negatively peaked T waves in V3-4 ( and in aVL) were associated with LAD disease.
The presence of peak negative T wave in V1-2 and/or negative T waves in III and V1 can help to differentiate PE from ACS, although this was present in only 76% of patients in their study. It is obviously not pathognomonic, but may assist in making the diagnosis. To answer the example above is that A is a PE and B is ischaemia. Did you pick it?
 3 Can features in the ECG predict those patients most likely to rapidly deteriorate?
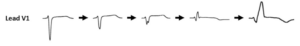
The most common ECG finding in patients prior to deteriorating into a PEA or asystolic arrest (67% of cases) was found to be a RBBB in V1, which progressed from an increasing RV delay (1) as shown below:
This right ventricular strain pattern along with any two of the following predicted the potential for deterioration:
- ST elevation V1
- Rightward directed ST elevation vector in limb leads (i.e. towards lead III) or
- Right axis deviation in limb leads
The following 6 findings predicted circulatory shock from pulmonary embolism (2):
- Sinus Tachycardia
- Atrial Fibrillation
- S1Q3T3
- RBBB
- T wave inversion in V2-V3
- ST Elevation in aVR
The Daniel Score (3) is a scoring system that is more related to predicting the severity of the disease, by assigning point to an ECG. It makes sense, that the worst the disease, the more chance of an ECG patient occurring.
A Daniel score > 10 indicates severe pulmonary hypertension
- Sinus Tachycardia(2 points)
- RBBB(incomplete)(2 points)
- RBBB(complete)(3 points)
- T wave inversion V1-V4(0-12 points)
- S wave in I(0 points)
- Q wave in III(1 point)
- Inverted T wave in III(1 point)
- S1Q3T3(2 points)
References
- Kosuge M et al. Electrocardiographic Differentiation Between Acute Pulmonary Embolism and Acute Coronary Syndromes on the Basis of Negative T waves. Am J Cardiol 2007;99:817-821
- Kosuge et al. Differences in negative T waves between Acute Pulmonary Embolism and Acute Coronary Syndrome. Circulation Journal 2014;78:483-489
- Do D H et al. Electrocardiographic right ventricular strain precedes hypoxic pulseless electrical activity cardiac arrests; Looking beyond p[ulmonary embolism. Resuscitation 151 (2020) pp127-134.
- Shopp Jd et al. Findings from 12-lead electrocardiography that predict Circulatory Shock From Pulmonary Embolism: Systematic review and Meta-Analysis. Acad Emerg med 2015 Oct;22(10):1127-1137.
- Daniel K R et al. Assessment of Cardiac Stress from Massive Pulmonary Embolism with 12-lead ECG. Chest 2001, Aug;120(2):474-81